


So You Want to Have an Energy Transition
Where we stand today, where (we hope) we're going, and how we'll get there
The United States does not have a credible plan to achieve anything close to 100% renewable energy by 2050, let alone by the Biden administration’s 2030 target. Lest I seem overly pessimistic, there’s plenty for renewables advocates to get excited about. Renewables are on track to provide over 25% of US electrical generation this year, a remarkable milestone. But excitement about this achievement should be tempered by the scale of the challenge ahead.
Let’s start with the current energy landscape. The US DoE’s Energy Information Administration (EIA) helpfully provides the current energy mix and forecasts its evolution.

The problem is obvious at a glance: this forecast doesn’t get us even close to the administration’s net zero goals: the IEA projects that would require nearly 90% of generation to come from renewables.1 These estimates are based on “business as usual” policies that roughly maintain the status quo. So what changes would it take to get there? The EIA can help us out here as well.
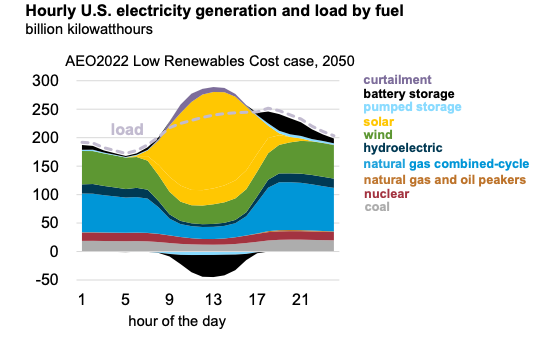
The figure above illustrates the daily generation and load profiles under EIA’s most aggressive renewables deployment schedule. This only gets us to ~58% renewables, but it shows us the rough shape of the problem: we need to squash the “shoulders” of the generation profile which result from the intermittent nature of solar power. But handling daily variability won't be enough. Renewables vary daily, seasonally, and geographically:2
To overcome this we need more renewables generation, more transmission capacity, and MUCH more storage.
Generation
Generation is going to be the easiest piece of the puzzle to solve. The Lazards levelized cost of energy (LCOE)3 analysis above shows that utility scale solar and wind are both competitive with natural gas.4 We already have the technology we need, it’s simply a question of (massively) scaling up.
It’s worth a couple of words here on hydro and nuclear. Hydropower provides around 8% of our electricity, but has limited potential for scale. DoE estimates that hydro could provide no more than 400 TWh of additional generation in the US: material, but not sufficient on its own. Nuclear power is a vastly complex topic that I can’t do justice to here. Suffice it to say that nuclear fission has tremendous potential as an energy source, but we’ve hamstrung ourselves very thoroughly with regulation. It’s hard to imagine a meaningful increase in its share of the energy mix any time in the next decade, but with concerted effort it could be the linchpin of our 30-year energy strategy. I’ll leave a discussion of that for another time.
On the other hand, we’re arguably wasting money on residential solar. Residential solar is highly visible, but it’s not cost effective: Lazard's estimates it costs 3-5X more per kWh to generate solar at the residential rather than utility scale. This makes intuitive sense: larger installations can benefit from economies of scale. But it’s worth digging into the cost structure of residential solar to see where this disparity comes from:

Historical declines were driven first and foremost by declines in 1) module costs, 2) labor costs (likely reflecting a learning curve). The decline in module costs has gotten a lot of press, but in the case of residential solar we’ve already realized most of the benefit: modules make up only 15% of total cost. A further 90% decline in module costs would save 13.5% of total cost. By contrast, modules account for 42% of costs for utility scale projects, leaving much more room for improvement.
Soft costs account for over 50% of the cost structure. These include general overhead (10% of total cost); customer acquisition costs (16%); permitting, inspection, and interconnection (9%), and profit margin (11%). Operations & maintenance accounts for ~5% of LCOE for solar. While there are certainly gains to be had in these areas, there are no magic bullets here. Further progress is likely to be incremental rather than transformative.
Taken together, this means there’s very little prospect that residential solar will ever be competitive with utility scale solutions. Individual decisions to install residential solar may be rational in some circumstances, but as a policy matter we would make more efficient use of our tax dollars by shifting incentives away from residential solar and toward utility scale projects.
Research by Tong et. al. from Tsinghua and Stanford Universities suggests that we will need to build renewables capacity of 1.5X total demand—8,300 TWh in 2050—to meet 99% of our needs with renewables. This overbuild is necessary (but not sufficient, as we shall see) to deliver reliable power from a variable source. Optimizing for reliability, the same research suggests US should target roughly 2/3rds wind, 1/3rd solar. This takes advantage of the fact that seasonal variations in wind and solar partially cancel each other out:

Wind and solar are fairly comparable from a cost perspective, and wind also has up to 75% lower embedded emissions than solar. Despite this, we’re not building enough wind right now:
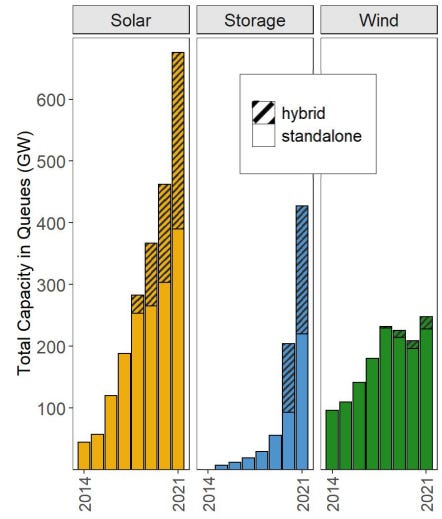
One reason for this is land use: wind farms require up to 10X more land per unit power than solar.5 This makes it more difficult to identify and secure sites for new wind capacity. Some of it is due to supply chain disruptions. Partly it’s regulatory uncertainty: key tax incentives expired in 2021 and it was unclear whether they’d be restored until the IRA passed this year.
But there’s another reason, one that has more to do with where renewables are found and how energy gets where it’s needed.
Transmission
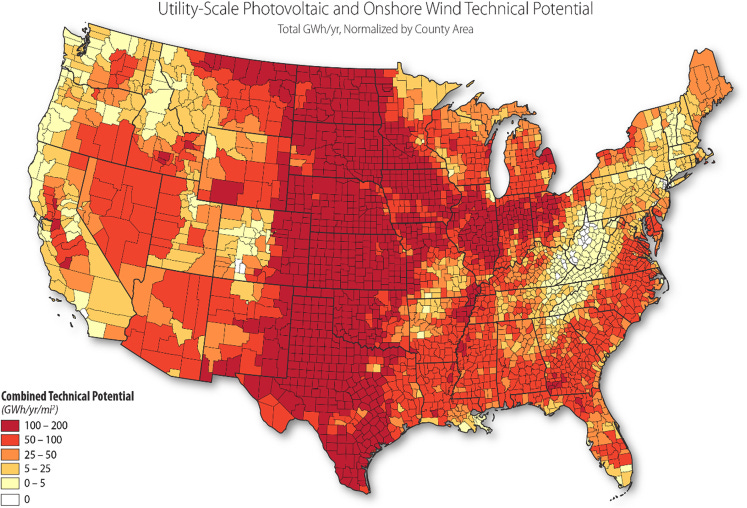
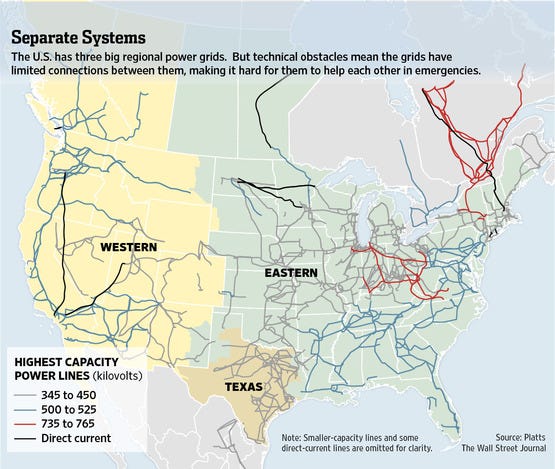
The first figure above shows us where wind and solar resource potential is the highest; the second displays the power grid. A critical, obvious issue arises from comparing these two maps: the areas with the highest renewable energy density tend to have the lowest density of high capacity transmission lines. This is especially true for the wind resource, which is strongest in the Great Plains.
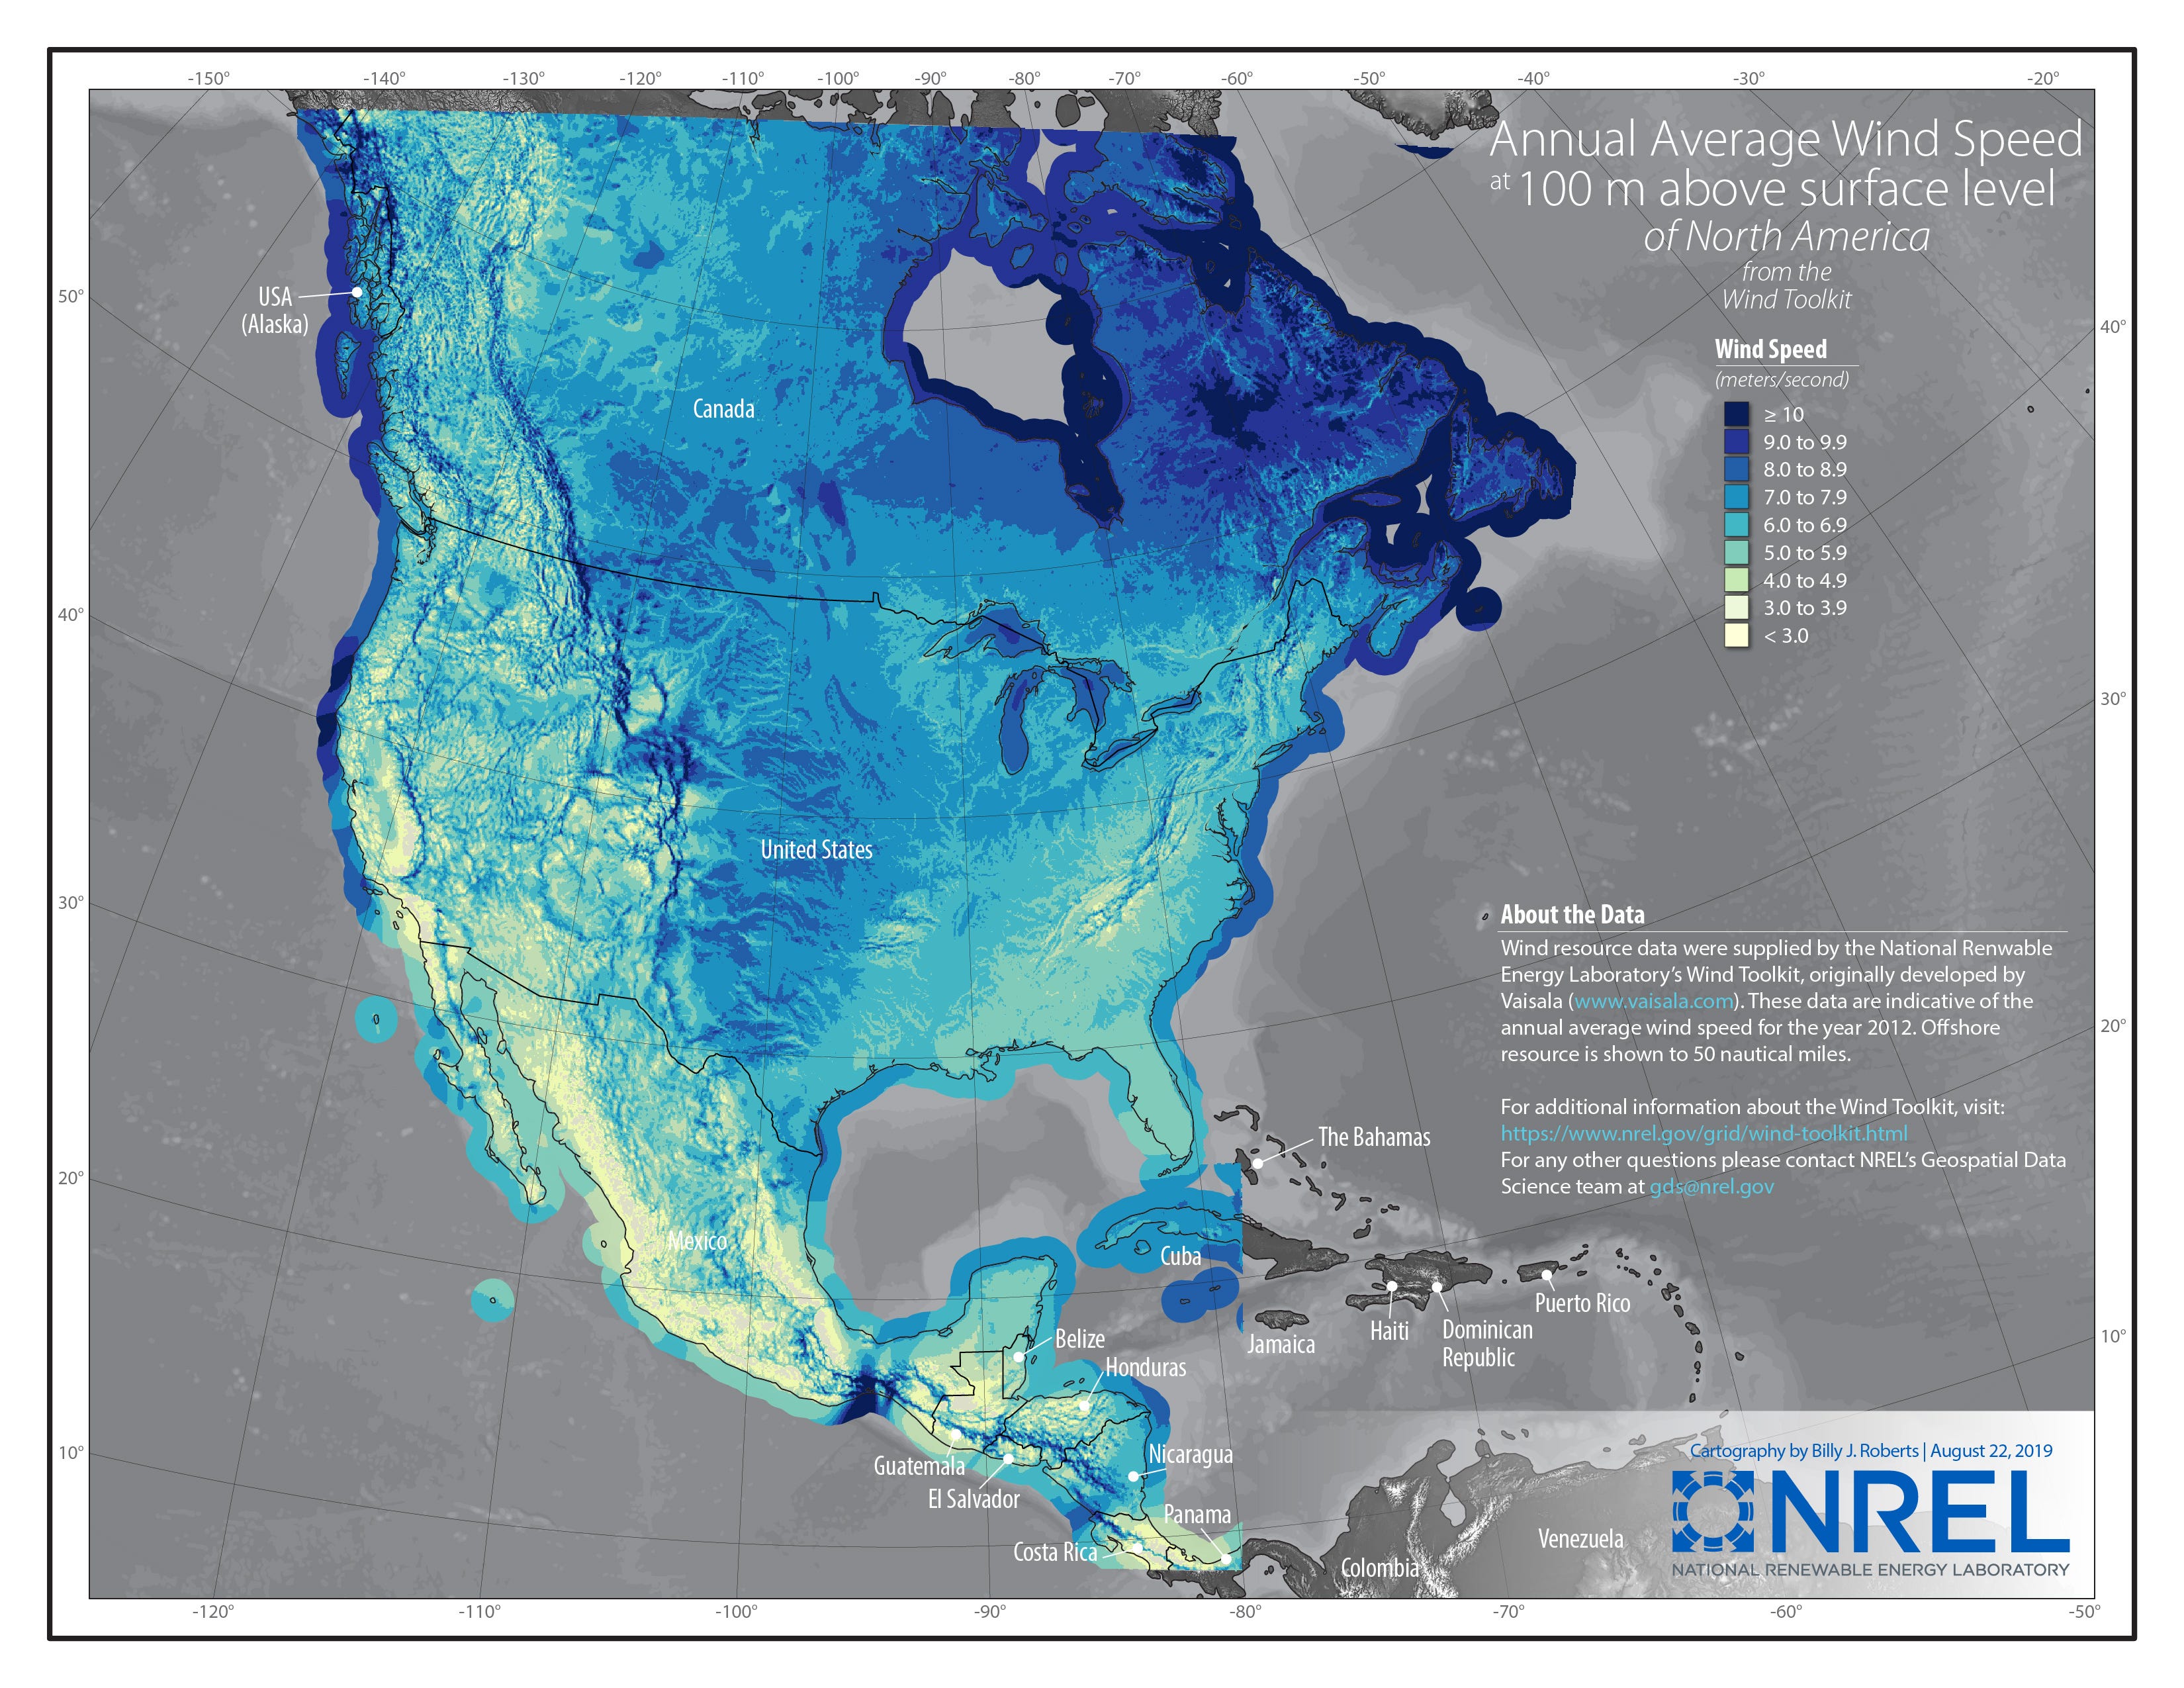
This partially explains why wind is being under-built: new wind projects are frequently burdened with the cost of additional transmission capacity. The DoE estimates that high-voltage DC (HVDC) transmission costs $3.9M/mile to build with an amortized cost of ~$41/MWh/1,000 miles. Even if you don’t need any new lines, transmitting power over long distances is expensive. The same report estimates operating costs at roughly 15% of total cost ($6/MWh/1,000 miles). Transmission losses are also significant (12.9% per 1,000 miles).
In the US, distribution (i.e., the power lines in your neighborhood) costs over 2x as much as transmission to operate according to EIA. Construction of new distribution lines is on the order of 10% as much as transmission lines (~$250k/mile), but there are 27X more miles of distribution lines than transmission lines. As more electric vehicles and heat pumps are deployed, local distribution grids will need additional capacity. Distributed energy resource management solutions can help obviate some of this need by intelligently coordinating demand to reduce stress on the grid, but they can’t eliminate the need entirely.
The DoE is already taking steps to address this need, providing $8B in funding and loan guarantees for new transmission projects, enough to complete roughly 2,000 miles of new capacity. This is a good first step, but likely less than half of what will be required. A much higher degree of interconnection between the Western, Eastern, and Texas grids will be required to efficiently meet reliability requirements.
There are alternative solutions to circumvent challenges associated with transmission. Sometimes called power-to-X, these solutions convert electricity into an alternative energy carrier that can be stored and physically transported. Most prominent among these is green hydrogen, which has received the bulk of the tax incentives and R&D dollars in the space. Very significant problems remain: hydrogen has ~30% round-trip efficiency and is also explosive & expensive relative to fossil fuels. There are other candidates, but the truth is we haven’t solved this problem yet. The plan of record seems to be build more transmission lines and eat the costs.
Storage
The EIA forecast from the beginning of this dispatch already includes 670 GWh of storage capacity by 2050. This is a massive increase from 4.6 GWh in 2021, but it only gets us to ~58% renewables. The previously cited research from Tong et. al. suggests that we will need to build 12h of storage capacity (7.5 TWh) to meet 99% of our electricity needs with renewables (in addition to the 8,300 TWh of generation). Even in this scenario, there will still be up to 100 hours per year with some level of unmet demand.
To be clear, these are stupendously large numbers: we’re talking about enough wind and solar to cover the entire Texas panhandle, and more storage than has been produced in the history of the world. To deploy 7.5 TWh of storage by 2050 would require us to increase our installed capacity by 27% per year for the next 30 years. For comparison, mobile phone adoption grew by ~19% per year from 1995-2019; internet use grew by 22% over the same period. Getting to 99% renewables in the US would require energy storage to grow faster than either, but without the benefit of network effects.
On the positive side, the costs to build this storage are surprisingly manageable. At today's prices this would cost ~$215B based on Lazard's estimates, or $7.2B per year. NREL believes these costs could decline by 60% under a much more conservative production schedule; it might ultimately cost less than $50B if economies of scale and learning effects are strong enough.
Unlike the generation sector, there is significant technology risk left in the storage sector. To date, the vast majority of battery energy storage systems (BESS) have been lithium-ion. But not all storage is created equal: lithium-based batteries are only cost effective for durations of < 4-6 hours.6 Long-duration storage (generally defined as >10 hours) is required to deliver firm baseload power.
Long-duration storage is one of the most active areas of investment and progress in the energy sector. BESS using alternative chemistries, pumped hydro, compressed air, thermal storage, flywheels, and green hydrogen are all potential solutions here. They span a range of technological maturity levels, but only pumped hydro has been widely deployed (primarily alongside nuclear power plants). The DoE has $22B in loan guarantees targeting clean energy, which includes long-duration storage technologies. If we’re going to have an energy transition, long-duration storage is the key missing piece of the puzzle.
Conclusions
This analysis drives a handful of policy recommendations to accelerate the energy transition.
First, we should stop incentivizing residential solar and channel those dollars to utility scale projects. We’ll see 3-5X higher ROI in terms of GW deployed.
Second, we must radically increase our investment in new transmission infrastructure, especially in the Great Plains. This is relevant for all forms of renewables, but is especially important for wind power.
Third, we need additional incentives for wind power, including incentives for farmers and other land owners to site turbines on their property. This can help overcome constraints on site selection and will be key to delivering a reliable energy mix.
Finally, we need continued investment in long-duration storage solutions, especially alternatives to hydrogen. We’re likely to see some of these technologies get wider adoption over the next 3 years. Once they achieve technical readiness, we’re going to need a massive investment in storage capacity to overcome the intermittency of renewables.
All of these things are doable, and most are fairly non-controversial. Achieving them would bring us much closer to making the energy transition a reality.
Confusingly, the Energy Information Administration (EIA) is part of the US Department of Energy and is different from the International Energy Agency (IEA), an “autonomous inter-governmental organization within the OECD framework.”
The color scale on the gif below runs from 165-240 W/m^2. This clips a bit at the high end: GHI averages ~300 W/m^w in New Mexico in July. This is a daily average: NM can receive ~7 “peak sun hours” each day. A peak sun hour is equivalent to 1,000 W/m^2.
The levelized cost of energy combines operating costs with amortized capital costs over the life of the asset, providing a way to compare different energy sources on an apples-to-apples basis.
The gold diamonds in the plot above represent the marginal cost of production. Once renewables scale up enough to drive prices below this point, alternative generation sources will shut down.
This is true if the site is used only for wind power, i.e., it considers the total footprint of the wind farm rather than the physical footprint of the equipment. The physical footprint of wind is significantly smaller than that of solar.
This limit is related to the energy and power densities of lithium batteries as well as safety constraints.